Whether running enterprise edge clusters, client web servers, or a dedicated homelab, continuous visibility into service availability is essential. When an outage strikes—whether caused by a power surge, an unannounced ISP fiber cut, or a crashed Docker container—you need to know before your users or clients do. Relying on commercial status page providers like Statuspage.io or Better Uptime often entails steep recurring monthly fees and limits your ability to inspect internal services residing behind CGNAT or strict corporate firewalls.
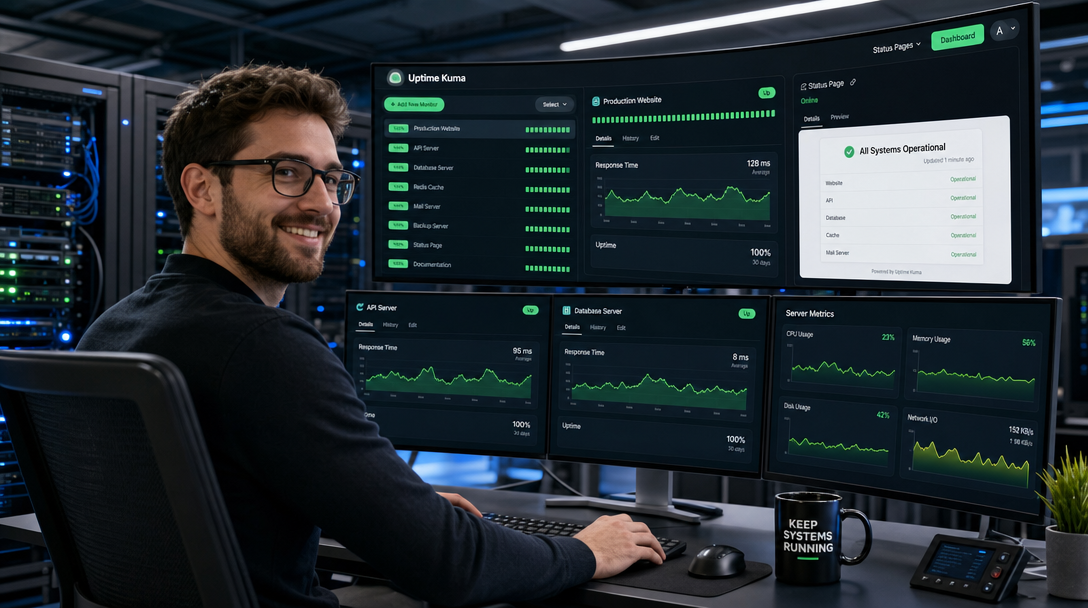
Uptime Kuma has emerged as the leading self-hosted, open-source monitoring solution. It features an intuitive web interface, sub-second latency tracking, diverse monitor types (HTTP, TCP, Ping, DNS, Docker, Push), and comprehensive alerting channels. However, self-hosters face a classic dilemma: how do you publicly publish a branded status page to the outside world without punching risky inbound holes in your firewall or exposing your residential IP address? The answer lies in combining Uptime Kuma with an outbound Cloudflare Tunnel. In this end-to-end technical guide, you will deploy Uptime Kuma and a cloudflared daemon with Docker Compose to create a resilient, zero-open-port monitoring platform.
Architecture: Zero-Trust Tunneling Topology
Traditional setups require opening firewall port 80/443 on your edge router and configuring dynamic DNS (DDNS) with port forwarding. Cloudflare Tunnels eliminate inbound routing altogether by establishing persistent, encrypted outbound connections (via QUIC over UDP or HTTP/2 over TCP) directly from your container to Cloudflare’s global edge network.
+-----------------------------------------------------------------------------------+
|                        Public Internet / Mobile Subscribers                       |
+-----------------------------------------------------------------------------------+
                                         |
                                         | HTTPS (status.yourdomain.com)
                                         v
+-----------------------------------------------------------------------------------+
|                           Cloudflare Global Edge Network                          |
|         - Anycast DNS, DDoS Mitigation, WAF, Automated Edge SSL Termination       |
|         - Cloudflare Access (SSO / OTP Authentication for Admin Paths)            |
+-----------------------------------------------------------------------------------+
                                         |
                                         | Outbound Encrypted Tunnel (QUIC / UDP)
                                         | [Zero Inbound Ports Opened on Host]
                                         v
+-----------------------------------------------------------------------------------+
|                              Local Docker Host (Host OS)                          |
|                                                                                   |
|  +---------------------------+              +----------------------------------+  |
|  | cloudflared Daemon        |              | Uptime Kuma Service              |  |
|  | (Tunnel Ingress Bridge)   | -- HTTP -->  | - SQLite Database Persistence    |  |
|  |                           |              | - Real-time WebSockets UI        |  |
|  +---------------------------+              +----------------------------------+  |
|                                                              |                    |
|                                                              | Polls & Checks     |
|                                                              v                    |
|  +-----------------------------------------------------------------------------+  |
|  |                     Internal Probing Targets & Endpoints                     |  |
|  |  - Docker Engine Socket (/var/run/docker.sock)                              |  |
|  |  - LAN Subnet Routers, Switches, NAS, Hypervisors (Ping / TCP Ports)        |  |
|  |  - Cron Heartbeats & Push Monitors (Dead Man's Switch Backups)              |  |
|  |  - External SaaS Endpoints & DNS Records                                    |  |
|  +-----------------------------------------------------------------------------+  |
+-----------------------------------------------------------------------------------+
Key architectural components:
- Uptime Kuma Core: Single-container Node.js service managing the scheduled worker threads, SQLite database, live WebSocket dashboard, and alert notification dispatchers.
- cloudflared Daemon: An unprivileged client container that dials outward to four independent Cloudflare edge data centers. It routes incoming traffic destined for your public status page directly to Uptime Kuma over a private Docker bridge.
- Docker Socket Proxy (Optional Hardening): Protects the host Docker API while allowing Uptime Kuma to read container health statuses without giving it full root socket control.
Step 1: Directory Setup & Cloudflare Tunnel Token
Create a dedicated directory structure for persistence on your host:
# Create deployment directories
sudo mkdir -p /opt/uptime-kuma/{data,cloudflared}
sudo chown -R 1000:1000 /opt/uptime-kuma
sudo chmod -R 750 /opt/uptime-kuma
Before launching the compose stack, obtain your unique Cloudflare Tunnel token:
- Log in to the Cloudflare Zero Trust Dashboard (
dash.teams.cloudflare.com). - Navigate to Networks > Tunnels and click Create a Tunnel.
- Select Cloudflared as the connector type and name your tunnel (e.g.,
homelab-monitoring). - In the installation command section, choose Docker. You will see a command containing a long token string starting with
eyJh.... Copy this token.
Step 2: Environment Configuration (.env)
Create /opt/uptime-kuma/.env and save your token securely:
# ==============================================================================
# Uptime Kuma & Cloudflare Tunnel Configuration
# ==============================================================================

TZ=UTC
UPTIME_KUMA_PORT=3001

# Cloudflare Zero Trust Tunnel Token
CLOUDFLARE_TUNNEL_TOKEN=eyJhYmNkZWZ...YOUR_COMPLETE_TOKEN_STRING_HERE...
Restrict file access permissions to root:
sudo chmod 600 /opt/uptime-kuma/.envStep 3: Docker Compose Stack Definition
Create /opt/uptime-kuma/docker-compose.yml. Notice that Uptime Kuma requires the NET_RAW capability to execute raw ICMP Ping checks, and we bind port 3001 exclusively to 127.0.0.1 for secure local access:
services:
  uptime-kuma:
    container_name: uptime_kuma
    image: louislam/uptime-kuma:1
    restart: unless-stopped
    volumes:
      - /opt/uptime-kuma/data:/app/data
      - /var/run/docker.sock:/var/run/docker.sock:ro
    ports:
      - "127.0.0.1:${UPTIME_KUMA_PORT}:3001"
    cap_add:
      - NET_RAW
    networks:
      - monitoring_network
    healthcheck:
      test: ["CMD-SHELL", "node /app/extra/healthcheck.js"]
      interval: 15s
      timeout: 5s
      retries: 3
      start_period: 20s

  cloudflared:
    container_name: uptime_cloudflared
    image: cloudflare/cloudflared:latest
    restart: unless-stopped
    command: tunnel run
    environment:
      - TUNNEL_TOKEN=${CLOUDFLARE_TUNNEL_TOKEN}
    depends_on:
      uptime-kuma:
        condition: service_healthy
    networks:
      - monitoring_network

networks:
  monitoring_network:
    driver: bridge
Step 4: Launching Stack & Public Ingress Routing
Start the stack in detached mode:
cd /opt/uptime-kuma
docker compose up -d

# Verify container statuses
docker compose ps
Ensure both services report healthy states:
NAME                 IMAGE                           STATUS
uptime_kuma          louislam/uptime-kuma:1          Up (healthy)
uptime_cloudflared   cloudflare/cloudflared:latest   Up
Now return to your Cloudflare Zero Trust Tunnel configuration in the dashboard:
- Under your tunnel settings, click the Public Hostname tab.
- Click Add a public hostname.
- Subdomain:
status| Domain:yourdomain.com - Service Type:
HTTP| URL:uptime_kuma:3001 - Click Save hostname.
Within seconds, Cloudflare will automatically synthesize DNS CNAME records and issue an edge TLS certificate. Navigating to https://status.yourdomain.com will seamlessly connect to your self-hosted container through the tunnel.
Step 5: Configuring Essential Monitors
Log in to your newly deployed Uptime Kuma dashboard and configure diverse monitoring probes to cover your infrastructure stack:
1. HTTP(s) Keyword Probes
Checking for HTTP status 200 is often insufficient (a web server might return 200 on an error page). Configure a Keyword monitor:
- Monitor Type: HTTP(s) – Keyword
- URL:
https://api.yourdomain.com/healthz - Keyword:
"status": "healthy" - Heartbeat Interval: 30 seconds
- Retries: 2 times before triggering notification
2. Docker Container Health Status
Because we mounted /var/run/docker.sock:ro, Uptime Kuma can directly query container daemon lifecycles without generating network traffic:
- Monitor Type: Docker Container
- Docker Daemon:
/var/run/docker.sock - Container Name:
immich_server
3. Push Monitor (Dead Man’s Switch for Automated Backups)
When running automated nightly backup scripts (e.g., Restic, Borg, or pg_dump), you want an alert if the backup fails or hangs. Create a Push Monitor in Uptime Kuma. It generates a unique webhook URL: https://status.yourdomain.com/api/push/k2J9xL4m?status=up&msg=OK&ping=.
Append a curl trigger to your backup scripts:
# At the conclusion of your successful backup routine:
curl -fsS -m 10 --retry 3 "https://status.yourdomain.com/api/push/k2J9xL4m?status=up&msg=Backup+Completed"
If Uptime Kuma does not receive the ping within the expected window (e.g., 25 hours), it immediately triggers a critical alert.
Step 6: Setting Up Multi-Channel Alert Routing
Uptime Kuma supports over 50 alert dispatchers out of the box, including Discord, Telegram, Pushover, Slack, Gotify, and generic Webhooks. To set up Discord notifications:
- In your Discord server, go to Channel Settings > Integrations > Webhooks > New Webhook.
- Copy the Discord Webhook URL.
- In Uptime Kuma, navigate to Settings > Notifications > Setup Notification.
- Select Discord, paste the Webhook URL, assign a bot username (
Uptime Sentinel), and click Test. - Enable Default enabled so all new monitors automatically inherit alerting.
Step 7: Creating Branded Public Status Pages
To provide clients and external stakeholders with a transparent overview of service health, configure a customized public status page:
- Click Status Pages in the top navigation bar and select New Status Page.
- Name:
Company Systems Status| Slug:services - Organize monitors into logical groups: Core API Services, Web Endpoints, and Infrastructure Servers.
- Add a custom description, company logo, and enable Show Powered By or custom CSS for branding.
- Click Save. Visitors navigating to
https://status.yourdomain.com/status/serviceswill see live status badges and 90-day incident histories.
Security Hardening: Protecting the Admin UI
While your status page should be world-accessible, the Uptime Kuma management interface should never be exposed to public bruteforce attacks. Leverage Cloudflare Access (Zero Trust Application) to protect administrative paths:
- In the Cloudflare Zero Trust Dashboard, navigate to Access > Applications > Add an Application.
- Select Self-hosted.
- Application Name:
Uptime Kuma Management| Subdomain:status.yourdomain.com| Path:/dashboard* - Create an Access Policy: Rule action: Allow | Include rule: Emails ending in:
@yourcompany.com(or One-Time PIN / GitHub SSO). - Click Save application.
Public users visiting https://status.yourdomain.com/status/services load the public dashboard uninhibited, while anyone attempting to open the administrative settings must pass through Cloudflare Multi-Factor Authentication.
Troubleshooting Common Deployment Issues
Issue 1: Ping (ICMP) Monitors Fail with “Permission Denied”
Symptom: ICMP ping monitors show 100% packet loss and return: ping: socket: Operation not permitted.
Cause: Modern container runtimes drop raw network capabilities (CAP_NET_RAW) by default to prevent network spoofing.
Resolution: Explicitly grant the capability in your docker-compose.yml file under uptime-kuma:
    cap_add:
      - NET_RAW
If running on Debian/Ubuntu with strict unprivileged user namespaces, also adjust the host sysctl parameter: echo "net.ipv4.ping_group_range = 0 2147483647" | sudo tee -a /etc/sysctl.conf && sudo sysctl -p.
Issue 2: Cloudflare Returns “502 Bad Gateway” on Tunnel Hostname
Symptom: Navigating to your tunnel domain results in a Cloudflare branded 502 Bad Gateway error.
Cause: The cloudflared container cannot reach uptime-kuma:3001 because they are not attached to the same Docker network, or the service name in Cloudflare’s dashboard is misspelled.
Resolution: Confirm both containers share the monitoring_network bridge. In the Cloudflare Tunnel Public Hostname configuration, ensure the URL is set to http://uptime_kuma:3001 (using the container name, not localhost).
Issue 3: Docker Socket Access Denied
Symptom: Docker container monitoring fails with: connect EACCES /var/run/docker.sock.
Cause: The node process inside Uptime Kuma runs under a non-root UID that does not have read permissions on the host’s docker.sock.
Resolution: Ensure the socket is mounted with read-only permissions (/var/run/docker.sock:/var/run/docker.sock:ro). For hardened installations, deploy tecnativa/docker-socket-proxy as a lightweight TCP proxy sidecar that strictly permits only GET /containers/json requests while blocking write/exec operations.
Conclusion & Operational Checklist
By coupling Uptime Kuma with Cloudflare Tunnels, you have established a professional monitoring platform that delivers:
- Zero Open Ports: No router port forwarding or DDNS exposure.
- Granular Probing: Native support for HTTP, TCP, Ping, Docker, and backup heartbeats.
- Multi-Channel Alerting: Instant failure notifications delivered directly to Discord, Telegram, or Webhooks.
- Hardened Access Control: Public status pages available to the world while admin consoles remain locked behind Cloudflare Access MFA.
Regular maintenance should include automated weekly SQLite database backups of /opt/uptime-kuma/data/kuma.db and periodic container updates via docker compose pull && docker compose up -d.

Hi, I’m Mark, the author of Clever IT Solutions: Mastering Technology for Success. I am passionate about empowering individuals to navigate the ever-changing world of information technology. With years of experience in the industry, I have honed my skills and knowledge to share with you. At Clever IT Solutions, we are dedicated to teaching you how to tackle any IT challenge, helping you stay ahead in today’s digital world. From troubleshooting common issues to mastering complex technologies, I am here to guide you every step of the way. Join me on this journey as we unlock the secrets to IT success.