As self-hosted homelabs and small business microservices expand across dozens of Docker containers, tracking down production anomalies quickly degrades into an exercise in frustration. Running docker logs -f <container_name> across multiple SSH terminal sessions is fragmented, unsearchable, and completely useless when investigating past container crashes or transient network timeouts. Furthermore, the default Docker json-file logging driver stores raw files directly on host disks, frequently triggering disk space alerts and ungraceful outages if log rotation is misconfigured.
Enterprise log aggregation suites such as the ELK Stack (Elasticsearch, Logstash, Kibana) or OpenSearch provide comprehensive search capabilities, but their astronomical resource footprints—often demanding 4 to 8 GB of RAM merely sitting idle—render them impractical for lightweight homelabs, edge nodes, and single-server environments. The modern, lightweight alternative is Grafana Loki paired with Vector.
Inspired by Prometheus, Grafana Loki does not build massive full-text inverted indexes on log payloads; instead, it indexes only stream metadata labels (such as container names, namespaces, and log levels) and compresses raw log chunks in object storage or local filesystems. When combined with Vector—an ultra-high-performance, memory-safe observability agent written in Rust that consumes under 50 MB of RAM—you get sub-second query speeds, advanced VRL (Vector Remap Language) parsing, and real-time visualization in Grafana with negligible system overhead.
Architecture: Centralized Observability Pipeline
In our architecture, Vector operates as a non-intrusive container on the Docker host. By mounting the Docker Unix socket (/var/run/docker.sock) in read-only mode, Vector automatically discovers every running and newly spawned container, extracts stdout/stderr streams, enriches records with Docker labels, parses JSON or logfmt payloads, and ships them over HTTP to the centralized Loki engine.
+--------------------------------------------------------------------------+
|  Host Operating System (Ubuntu Server / Debian / Proxmox VM)             |
|                                                                          |
|   +-------------------+  +-------------------+  +--------------------+   |
|   | Container: Caddy  |  | Container: Ollama |  | Container: MinIO   |   |
|   | (stdout / stderr) |  | (stdout / stderr) |  | (stdout / stderr)  |   |
|   +---------+---------+  +---------+---------+  +---------+----------+   |
|             |                      |                      |              |
|             +----------------------+----------------------+              |
|                                    |                                     |
|                       /var/run/docker.sock (Read-Only)                   |
|                                    |                                     |
|   +--------------------------------v---------------------------------+   |
|   | Vector Log Shipper Container (Rust - ~45 MB RAM)                 |   |
|   |                                                                  |   |
|   |  - Source: docker_logs (Auto-discovery & label extraction)       |   |
|   |  - Transform: VRL (JSON sanitization, log level normalization)   |   |
|   |  - Sink: Loki HTTP Push API (/loki/api/v1/push)                  |   |
|   +--------------------------------+---------------------------------+   |
|                                    |                                     |
|                      Internal Docker Bridge Network                      |
|                                    |                                     |
|   +--------------------------------v---------------------------------+   |
|   | Grafana Loki Storage Engine (Indexes labels, compresses chunks)  |   |
|   | Persistent Volume: /loki (Data retention & automatic compaction) |   |
|   +--------------------------------+---------------------------------+   |
|                                    |                                     |
|   +--------------------------------v---------------------------------+   |
|   | Grafana Web Dashboard (Port 3000)                                |   |
|   |  - Pre-provisioned Loki Data Source                              |   |
|   |  - Interactive LogQL queries, real-time live tail, & rate graphs |   |
|   +------------------------------------------------------------------+   |
+--------------------------------------------------------------------------+
Why Vector Outperforms Promtail and Fluentd
While Grafana Labs historically recommended Promtail for shipping logs to Loki, Promtail is currently in maintenance mode, with official recommendations shifting toward OpenTelemetry or Vector. Compared to Fluentd (Ruby-based, high CPU) and Logstash (JVM-based, high RAM), Vector offers decisive advantages:
- Minimal Footprint: Written in Rust, Vector boots in milliseconds and operates comfortably within 35–50 MB of memory under intense logging bursts.
- Vector Remap Language (VRL): Powerful, expression-oriented parsing language built into the binary. VRL safely extracts JSON keys, normalizes log timestamps, drops useless health-check lines, and redacts sensitive tokens before logs ever leave the node.
- Disk-Backed Buffering: If Loki restarts or undergoes maintenance, Vector seamlessly spools unacknowledged events to an on-disk buffer, guaranteeing zero log loss.
Step 1: Directory Structure & Host Permissions
Prepare a clean directory structure on your logging host to store service configurations, Loki index chunks, and Grafana dashboard templates:
sudo mkdir -p /opt/homelab-logging/{vector,loki,grafana/provisioning/datasources}
cd /opt/homelab-logging
Loki runs inside the container with user ID 10001. Set appropriate ownership on the data directory so the storage engine can write index files and chunk segments without permission errors:
sudo chown -R 10001:10001 /opt/homelab-logging/lokiStep 2: Vector Configuration (vector.yaml)
Create the pipeline specification at /opt/homelab-logging/vector/vector.yaml. Here, we configure:
- Sources: The
docker_logsprovider reads container streams directly via the Docker API socket. - Transforms: A VRL script parses incoming JSON payloads (e.g., from Traefik, Caddy, or application APIs) and labels errors, warnings, and info logs accordingly.
- Sinks: Vector forwards the formatted stream to Loki over the internal Docker network.
# /opt/homelab-logging/vector/vector.yaml
data_dir: /var/lib/vector

sources:
  docker_source:
    type: docker_logs
    exclude_units:
      - "vector" # Prevent recursive ingestion of Vector's own logs

transforms:
  parse_and_label:
    type: remap
    inputs:
      - docker_source
    source: |
      # Extract standard container metadata
      .container = .container_name
      .image = .image
      .stream = .stream

      # Attempt structured JSON parsing
      parsed, err = parse_json(.message)
      if err == null {
        .json = parsed
        if exists(parsed.level) {
          .level = downcase(string!(parsed.level))
        } else if exists(parsed.status) {
          status = to_int(parsed.status) ?? 200
          if status >= 500 {
            .level = "error"
          } else if status >= 400 {
            .level = "warn"
          } else {
            .level = "info"
          }
        }
      } else {
        # Fallback level detection from plaintext
        if match(.message, r'(?i)(fatal|panic|error)') {
          .level = "error"
        } else if match(.message, r'(?i)(warn|warning)') {
          .level = "warn"
        } else {
          .level = "info"
        }
      }

sinks:
  loki_sink:
    type: loki
    inputs:
      - parse_and_label
    endpoint: http://loki:3100
    encoding:
      codec: text
    labels:
      container: "{{ container }}"
      stream: "{{ stream }}"
      level: "{{ level }}"
    buffer:
      type: disk
      max_size: 268435456 # 256 MB buffer fallback if Loki is unreachable
Step 3: Loki Storage Engine Configuration (loki-config.yaml)
Create the Loki configuration at /opt/homelab-logging/loki/loki-config.yaml. We utilize the modern TSDB index shipper with single-store local filesystem storage, which is drastically faster and more disk-efficient than legacy BoltDB setups.
# /opt/homelab-logging/loki/loki-config.yaml
auth_enabled: false

server:
  http_listen_port: 3100
  grpc_listen_port: 9096
  log_level: info

common:
  path_prefix: /loki
  storage:
    filesystem:
      chunks_directory: /loki/chunks
      rules_directory: /loki/rules
  replication_factor: 1
  ring:
    kvstore:
      store: inmemory

schema_config:
  configs:
    - from: 2024-01-01
      store: tsdb
      object_store: filesystem
      schema: v13
      index:
        prefix: index_
        period: 24h

limits_config:
  reject_old_samples: true
  reject_old_samples_max_age: 168h # 7 days
  max_query_length: 720h           # 30 days
  max_cache_freshness_per_query: 10m
  retention_period: 336h           # 14 days automated retention

compactor:
  working_directory: /loki/compactor
  retention_enabled: true
  delete_request_store: filesystem
  compaction_interval: 10m
Step 4: Automated Grafana Data Source Provisioning
To avoid manually configuring the data source in the Grafana web UI after startup, create an automated provisioning file at /opt/homelab-logging/grafana/provisioning/datasources/datasources.yaml:
apiVersion: 1

datasources:
  - name: Loki
    type: loki
    access: proxy
    url: http://loki:3100
    isDefault: true
    jsonData:
      maxLines: 2000
    editable: true
Step 5: Production Docker Compose Stack
Create the master docker-compose.yml file in /opt/homelab-logging/. This brings up Vector, Loki, and Grafana in an isolated private bridge network, exposing only the Grafana web console (port 3000) to the host:
services:
  loki:
    image: grafana/loki:3.2.0
    container_name: logging-loki
    restart: unless-stopped
    command: -config.file=/etc/loki/local-config.yaml
    volumes:
      - ./loki/loki-config.yaml:/etc/loki/local-config.yaml:ro
      - ./loki/data:/loki
    networks:
      - logging-net
    healthcheck:
      test: ["CMD-SHELL", "wget -q --tries=1 -O- http://localhost:3100/ready | grep -q ready || exit 1"]
      interval: 10s
      timeout: 5s
      retries: 5

  vector:
    image: timberio/vector:0.41.0-alpine
    container_name: logging-vector
    restart: unless-stopped
    depends_on:
      loki:
        condition: service_healthy
    volumes:
      - /var/run/docker.sock:/var/run/docker.sock:ro
      - ./vector/vector.yaml:/etc/vector/vector.yaml:ro
      - vector_buffer:/var/lib/vector
    networks:
      - logging-net

  grafana:
    image: grafana/grafana:11.2.0
    container_name: logging-grafana
    restart: unless-stopped
    ports:
      - "3000:3000"
    environment:
      - GF_SECURITY_ADMIN_USER=admin
      - GF_SECURITY_ADMIN_PASSWORD=HomelabStrongPassword2026!
      - GF_USERS_ALLOW_SIGN_UP=false
    volumes:
      - ./grafana/provisioning:/etc/grafana/provisioning:ro
      - grafana_storage:/var/lib/grafana
    networks:
      - logging-net

networks:
  logging-net:
    name: homelab_logging_network
    driver: bridge

volumes:
  vector_buffer:
    name: logging_vector_buffer
  grafana_storage:
    name: logging_grafana_storage
Launch the entire observability suite:
docker compose up -dVerify that all three services are running healthy:
docker compose psStep 6: Querying Logs with LogQL in Grafana
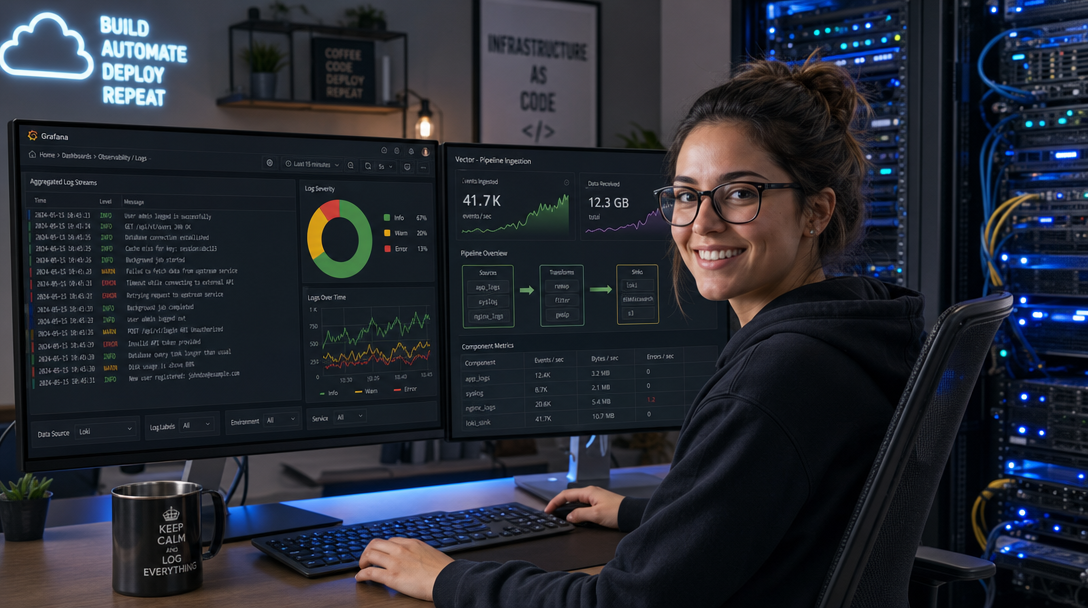
Open your browser and navigate to http://<your-server-ip>:3000. Log in using the admin credentials specified in your compose file. From the left navigation menu, open Explore and ensure the Loki data source is selected.
Here are essential LogQL queries for daily homelab operations:
1. Stream All Logs for a Specific Container
{container="caddy-reverse-proxy"}2. Filter for Errors Across All Running Containers
{level="error"} |= "Exception"3. Calculate Real-Time Log Rate per Second
Plot log volume over time to identify sudden error spikes or DDoS scanner probes:
sum by (container) (rate({container=~".+"}[1m]))Click Live in the top-right corner of the Explore interface to tail container logs in real time as events occur.
Troubleshooting Production Pitfalls
1. Permission Denied on /var/run/docker.sock
Symptoms: Vector fails to start, logging error: failed to connect to docker daemon: Permission denied (os error 13).
Resolution: The Docker socket is owned by root:docker. By default, Alpine containers run as root, which has access, but if your host uses strict AppArmor or SELinux policies, access is blocked. On Ubuntu/Debian, verify group membership with ls -l /var/run/docker.sock. If running rootless Docker, mount the user socket located at /run/user/1000/docker.sock instead.
2. Loki Rejects Entries with “Entry Too Far Behind”
Symptoms: Vector logs errors stating Server returned HTTP status 400 Bad Request: entry for stream '{...}' has timestamp too old.
Resolution: This occurs if a container logs historical timestamps or if the host clock has drifted out of sync. Ensure chrony or systemd-timesyncd is running on the host (timedatectl status). In loki-config.yaml, adjust reject_old_samples_max_age to 168h (7 days) to accommodate historical container backfills during initial ingestion.
3. Disk Space Creep & Unpruned Chunk Storage
Symptoms: The /opt/homelab-logging/loki/data/chunks directory continues growing indefinitely despite setting a retention period.
Resolution: In Loki 3.x, retention is enforced exclusively by the compactor service. Ensure that your loki-config.yaml contains both compactor.retention_enabled: true and limits_config.retention_period: 336h (14 days). Without the compactor block explicitly configured, Loki retains historical index chunks forever.
Conclusion & Next Steps
By pairing Vector’s sub-50MB Rust pipeline with Grafana Loki and Grafana Explore, you obtain a world-class, centralized logging solution tailored for homelabs and edge clusters. Container logs are captured automatically the moment a container boots, stripped of sensitive tokens, indexed efficiently by labels, and preserved safely against accidental deletion.
To securely access your new logging dashboard outside your home network, secure Grafana behind a Caddy reverse proxy with automatic SSL, or bridge your metrics with a VictoriaMetrics monitoring cluster for unified metrics and logs in a single pane of glass.

Hi, I’m Mark, the author of Clever IT Solutions: Mastering Technology for Success. I am passionate about empowering individuals to navigate the ever-changing world of information technology. With years of experience in the industry, I have honed my skills and knowledge to share with you. At Clever IT Solutions, we are dedicated to teaching you how to tackle any IT challenge, helping you stay ahead in today’s digital world. From troubleshooting common issues to mastering complex technologies, I am here to guide you every step of the way. Join me on this journey as we unlock the secrets to IT success.