Infrastructure observability is non-negotiable for system administrators, DevOps engineers, and homelab builders. However, mainstream monitoring stacks—such as Prometheus, Node Exporter, Alertmanager, and Grafana—often impose an ironic penalty: the monitoring tools themselves consume 1 GB to 3 GB of RAM, generate continuous disk I/O, and require intricate PromQL query maintenance. On resource-constrained edge devices, Raspberry Pis, or low-cost virtual private servers (VPS), running a heavyweight metrics pipeline frequently starves the very applications you are trying to monitor.
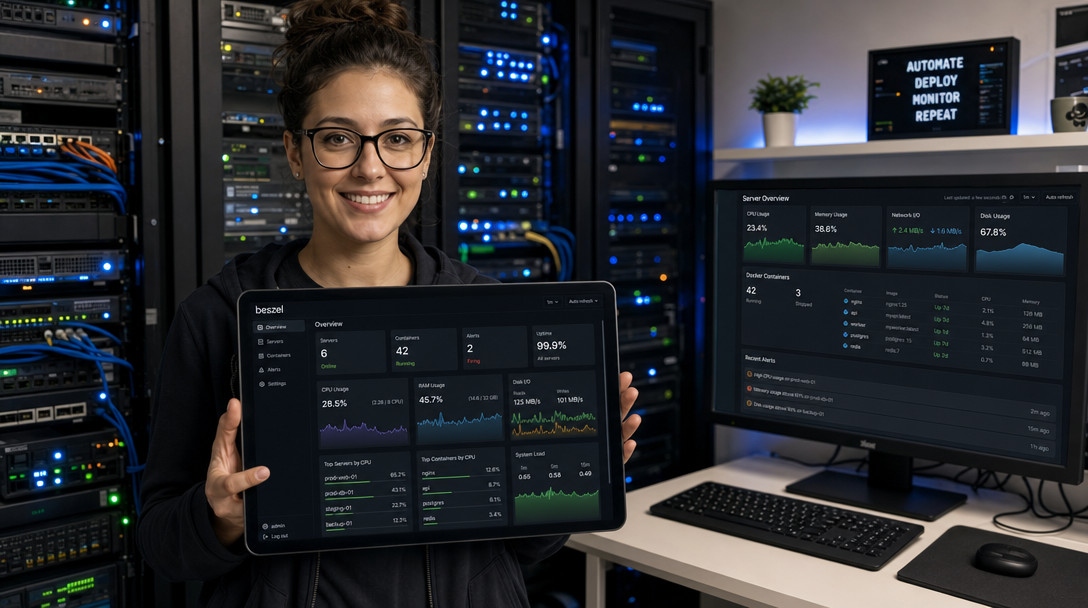
Beszel is the modern, minimalist antidote to monitoring bloat. Built with Go and PocketBase, Beszel operates as an ultra-lightweight server monitoring hub and agent that requires less than 50 MB of RAM. Despite its microscopic footprint, Beszel delivers comprehensive telemetry: host CPU, memory, disk I/O, network throughput, motherboard temperatures, GPU utilization (NVIDIA and AMD), and granular per-container Docker metrics. When deployed via Docker Compose, Beszel offers instant multi-server observability with zero configuration debt.
Architecture: Hub-and-Spoke Telemetry with PocketBase
Beszel employs an asymmetric hub-and-spoke architecture designed for minimal latency, secure communication, and zero cloud dependencies. It decouples the centralized web interface and storage engine from the distributed host collectors:
+-------------------------------------------------------------------------------+
|                            Client Web Browser / UI                            |
+---------------------------------------+---------------------------------------+
                                        |
                                        v (Port 8090 / HTTPS)
+-------------------------------------------------------------------------------+
|                             Beszel Hub Container                              |
|                         (PocketBase + Embedded SQLite)                        |
|  - Real-Time Live Dashboards        - Historical Timeseries Compression       |
|  - Multi-User RBAC & OAuth2         - Webhook, Discord & Telegram Alerts      |
+---------+-----------------------------+-----------------------------+---------+
          |                             |                             |
          | (Poll / SSH Key Encrypted)  | (Port 45876)                |
          v                             v                             v
+-------------------+         +-------------------+         +-------------------+
| Beszel Agent (A)  |         | Beszel Agent (B)  |         | Beszel Agent (C)  |
|  (Homelab Node 1) |         | (Cloud VPS Node)  |         | (NVIDIA GPU Host) |
|  - Host Telemetry |         |  - Host Telemetry |         |  - Host + GPU VRAM|
|  - Docker Sockets |         |  - Docker Sockets |         |  - Docker Sockets |
+-------------------+         +-------------------+         +-------------------+
In this architecture:
- Beszel Hub: Acts as the single-pane-of-glass controller. It queries or receives telemetry from remote agents, archives samples inside an optimized embedded SQLite database, and executes automated alerting rules across communication channels.
- Beszel Agent: Runs as a stateless binary or micro-container on every monitored host. It collects hardware sensor data, polls the local Docker daemon via
/var/run/docker.sock, and exposes an authenticated metrics endpoint protected by public-key cryptography. - Security Model: Unlike unauthenticated exporters, the Beszel Agent enforces public key verification. The agent will only communicate with a Beszel Hub that presents the matching private key corresponding to its configured
KEYenvironment variable.
Step 1: Host Preparation and Directory Structure
We will configure the Beszel Hub on your primary management server and deploy the Beszel Agent to monitor both the host itself and its co-located Docker containers. Create a dedicated workspace directory:
sudo mkdir -p /opt/beszel/{hub_data,agent_data}
cd /opt/beszel
sudo chown -R 1000:1000 /opt/beszel/hub_data
Step 2: Deploying the Beszel Hub with Docker Compose
Create the /opt/beszel/docker-compose.yml file to deploy the centralized hub. The hub exposes web port 8090 and persists its PocketBase database inside ./hub_data:
services:
  beszel-hub:
    image: henrygd/beszel:latest
    container_name: beszel_hub
    restart: unless-stopped
    ports:
      - "8090:8090"
    volumes:
      - ./hub_data:/beszel_data
    environment:
      - PORT=8090
      - APP_URL=http://monitoring.yourdomain.com
    networks:
      - monitoring_net
    healthcheck:
      test: ["CMD-SHELL", "wget --no-verbose --tries=1 --spider http://localhost:8090/api/health || exit 1"]
      interval: 30s
      timeout: 5s
      retries: 3

networks:
  monitoring_net:
    driver: bridge
Launch the Beszel Hub service:
docker compose up -d
Verify that the container initialized cleanly:
docker compose logs -f beszel-hub
Step 3: Initializing the Administrator Account and Extracting the Public Key
Open your browser and navigate to http://<YOUR-SERVER-IP>:8090. Upon first access, Beszel prompts you to create the primary administrator account (email and password).
Once logged into the dashboard:
- Click the Add System button in the upper-right corner.
- The dialog displays an automatically generated Public Key string (e.g.,
ssh-ed25519 AAAAC3NzaC1lZDI1NTE5...). - Copy this public key string to your clipboard. Every Beszel Agent requires this key to authenticate incoming telemetry requests from the Hub.
Step 4: Deploying the Beszel Agent for Host and Docker Telemetry
Now, deploy the Beszel Agent. The agent requires read-only access to host root mount points (to accurately report physical disk usage) and the Docker socket (to track per-container CPU, RAM, and network I/O).
Update /opt/beszel/docker-compose.yml to add the agent service alongside the hub:
services:
  beszel-hub:
    image: henrygd/beszel:latest
    container_name: beszel_hub
    restart: unless-stopped
    ports:
      - "8090:8090"
    volumes:
      - ./hub_data:/beszel_data
    environment:
      - PORT=8090
      - APP_URL=http://monitoring.yourdomain.com
    networks:
      - monitoring_net
    healthcheck:
      test: ["CMD-SHELL", "wget --no-verbose --tries=1 --spider http://localhost:8090/api/health || exit 1"]
      interval: 30s
      timeout: 5s
      retries: 3

  beszel-agent:
    image: henrygd/beszel-agent:latest
    container_name: beszel_agent
    restart: unless-stopped
    network_mode: host
    volumes:
      - /var/run/docker.sock:/var/run/docker.sock:ro
      - /:/extra-filesystems/host:ro
    environment:
      - PORT=45876
      - KEY="PASTE_YOUR_PUBLIC_KEY_STRING_HERE"
      - FILESYSTEM=/extra-filesystems/host
    healthcheck:
      test: ["CMD-SHELL", "wget --no-verbose --tries=1 --spider http://localhost:45876/health || exit 1"]
      interval: 30s
      timeout: 5s
      retries: 3

networks:
  monitoring_net:
    driver: bridge
Configuration Highlights:
network_mode: host: Enables the agent to query the host’s physical network adapters directly, preventing Docker bridge NAT translation from masking real network throughput./var/run/docker.sock:ro: Grants read-only access to container performance metrics without exposing write or administrative control over Docker.FILESYSTEM=/extra-filesystems/host: Directs the agent to evaluate the physical root filesystem rather than the ephemeral container disk.
Update the running deployment to launch the agent:
docker compose up -d
docker compose logs -f beszel-agent
Step 5: Registering the Monitored System in the Hub
Return to the Beszel Hub web dashboard at http://<YOUR-SERVER-IP>:8090:
- In the Add System modal, complete the fields:
- Name:
primary-homelab-node - Host / IP:
127.0.0.1(or the remote server’s IP address if monitoring external nodes) - Port:
45876
- Name:
- Click Save.
Within 15 to 30 seconds, the status indicator will turn green. Clicking into the node reveals a live, high-refresh dashboard rendering CPU frequency, memory caching, storage read/write rates, active Docker container metrics, and hardware temperatures.
Step 6: Setting Up Multi-Channel Threshold Alerts
Beszel includes native support for automated incident notification. You can configure alert thresholds per system or globally across your entire fleet.
To configure Discord or Telegram alerting:
- In the Beszel web interface, navigate to the target system and click Alerts.
- Define trigger conditions:
- CPU Usage: Greater than
90%for10 minutes. - Memory Usage: Greater than
85%for5 minutes. - Disk Usage: Greater than
85%on partition/. - Status: Alert immediately when the agent fails to report for
60 seconds(Offline Detection).
- CPU Usage: Greater than
- In the Notification Settings panel, insert your Discord Webhook URL or Telegram Bot Token and Chat ID.
- Click Send Test Notification to verify that delivery succeeds.
Security Hardening & Production Best Practices
1. Firewall Protection for Agent Endpoints
Because the Beszel Agent uses network_mode: host, it binds directly to port 45876 on all host interfaces. If monitoring a remote VPS across the public internet, restrict port 45876 so only your Beszel Hub’s static IP address can establish connections:
# Deny public access to Beszel Agent
sudo ufw deny 45876/tcp

# Whitelist only the Beszel Hub's public IP
sudo ufw allow from 203.0.113.50 to any port 45876 proto tcp comment "Beszel Hub Ingress"
sudo ufw reload
2. Automated SQLite Database Backups
Beszel stores historical metrics and alert histories in PocketBase’s embedded SQLite database. Protect this data with an automated daily snapshot:
sudo tar -czvf /opt/beszel-backup-$(date +%F).tar.gz /opt/beszel/hub_data
sudo chmod 600 /opt/beszel-backup-*.tar.gz
Troubleshooting Common Beszel Monitoring Issues
1. Hub Displays “Connection Refused” or “Host Unreachable”
Symptom: The system row in the dashboard remains yellow or red with a connection timeout error.
Root Cause: Port 45876 is blocked by the local host firewall, or the agent container crashed due to an invalid KEY environment variable.
Solution: Verify that the agent container is running and listening:
# Check container status and logs
docker compose logs beszel-agent

# Test local port connectivity
curl -I http://localhost:45876/health
2. Docker Container Metrics Missing or Empty in Dashboard
Symptom: System-level metrics (CPU, RAM) display correctly, but the Docker containers tab remains blank.
Root Cause: The agent cannot access the Docker daemon socket due to socket permission restrictions.
Solution: Ensure /var/run/docker.sock:/var/run/docker.sock:ro is correctly mounted. Verify that the Docker socket permissions allow read access:
ls -l /var/run/docker.sock
# Output should show: srw-rw---- 1 root docker ...
3. Host Filesystem Reports Container Overlay Size Instead of Physical Disk
Symptom: Disk space graphs reflect a tiny 10 GB or 20 GB volume instead of your host’s multi-terabyte NVMe or ZFS pool.
Root Cause: The environment variable FILESYSTEM=/extra-filesystems/host was omitted or the host mount point /:/extra-filesystems/host:ro was not specified.
Solution: Ensure both the volume mapping and the FILESYSTEM environment variable are declared in docker-compose.yml and restart the agent.
Summary and Key Takeaways
Beszel represents a massive paradigm shift in homelab and small-to-medium server monitoring. By eliminating the memory-hungry Prometheus/Grafana runtime and substituting it with an ultra-optimized Go binary backed by PocketBase, you reclaim hundreds of megabytes of valuable memory while retaining real-time visibility into system health, GPU metrics, and container workloads.
With native Docker socket integration, cryptographic public-key pairing, and instant multi-channel alerting, Beszel proves that enterprise-grade observability does not require enterprise-grade resource consumption. Place the hub behind an encrypted reverse proxy like Caddy or Traefik, and manage your distributed servers with effortless precision.

Hi, I’m Mark, the author of Clever IT Solutions: Mastering Technology for Success. I am passionate about empowering individuals to navigate the ever-changing world of information technology. With years of experience in the industry, I have honed my skills and knowledge to share with you. At Clever IT Solutions, we are dedicated to teaching you how to tackle any IT challenge, helping you stay ahead in today’s digital world. From troubleshooting common issues to mastering complex technologies, I am here to guide you every step of the way. Join me on this journey as we unlock the secrets to IT success.